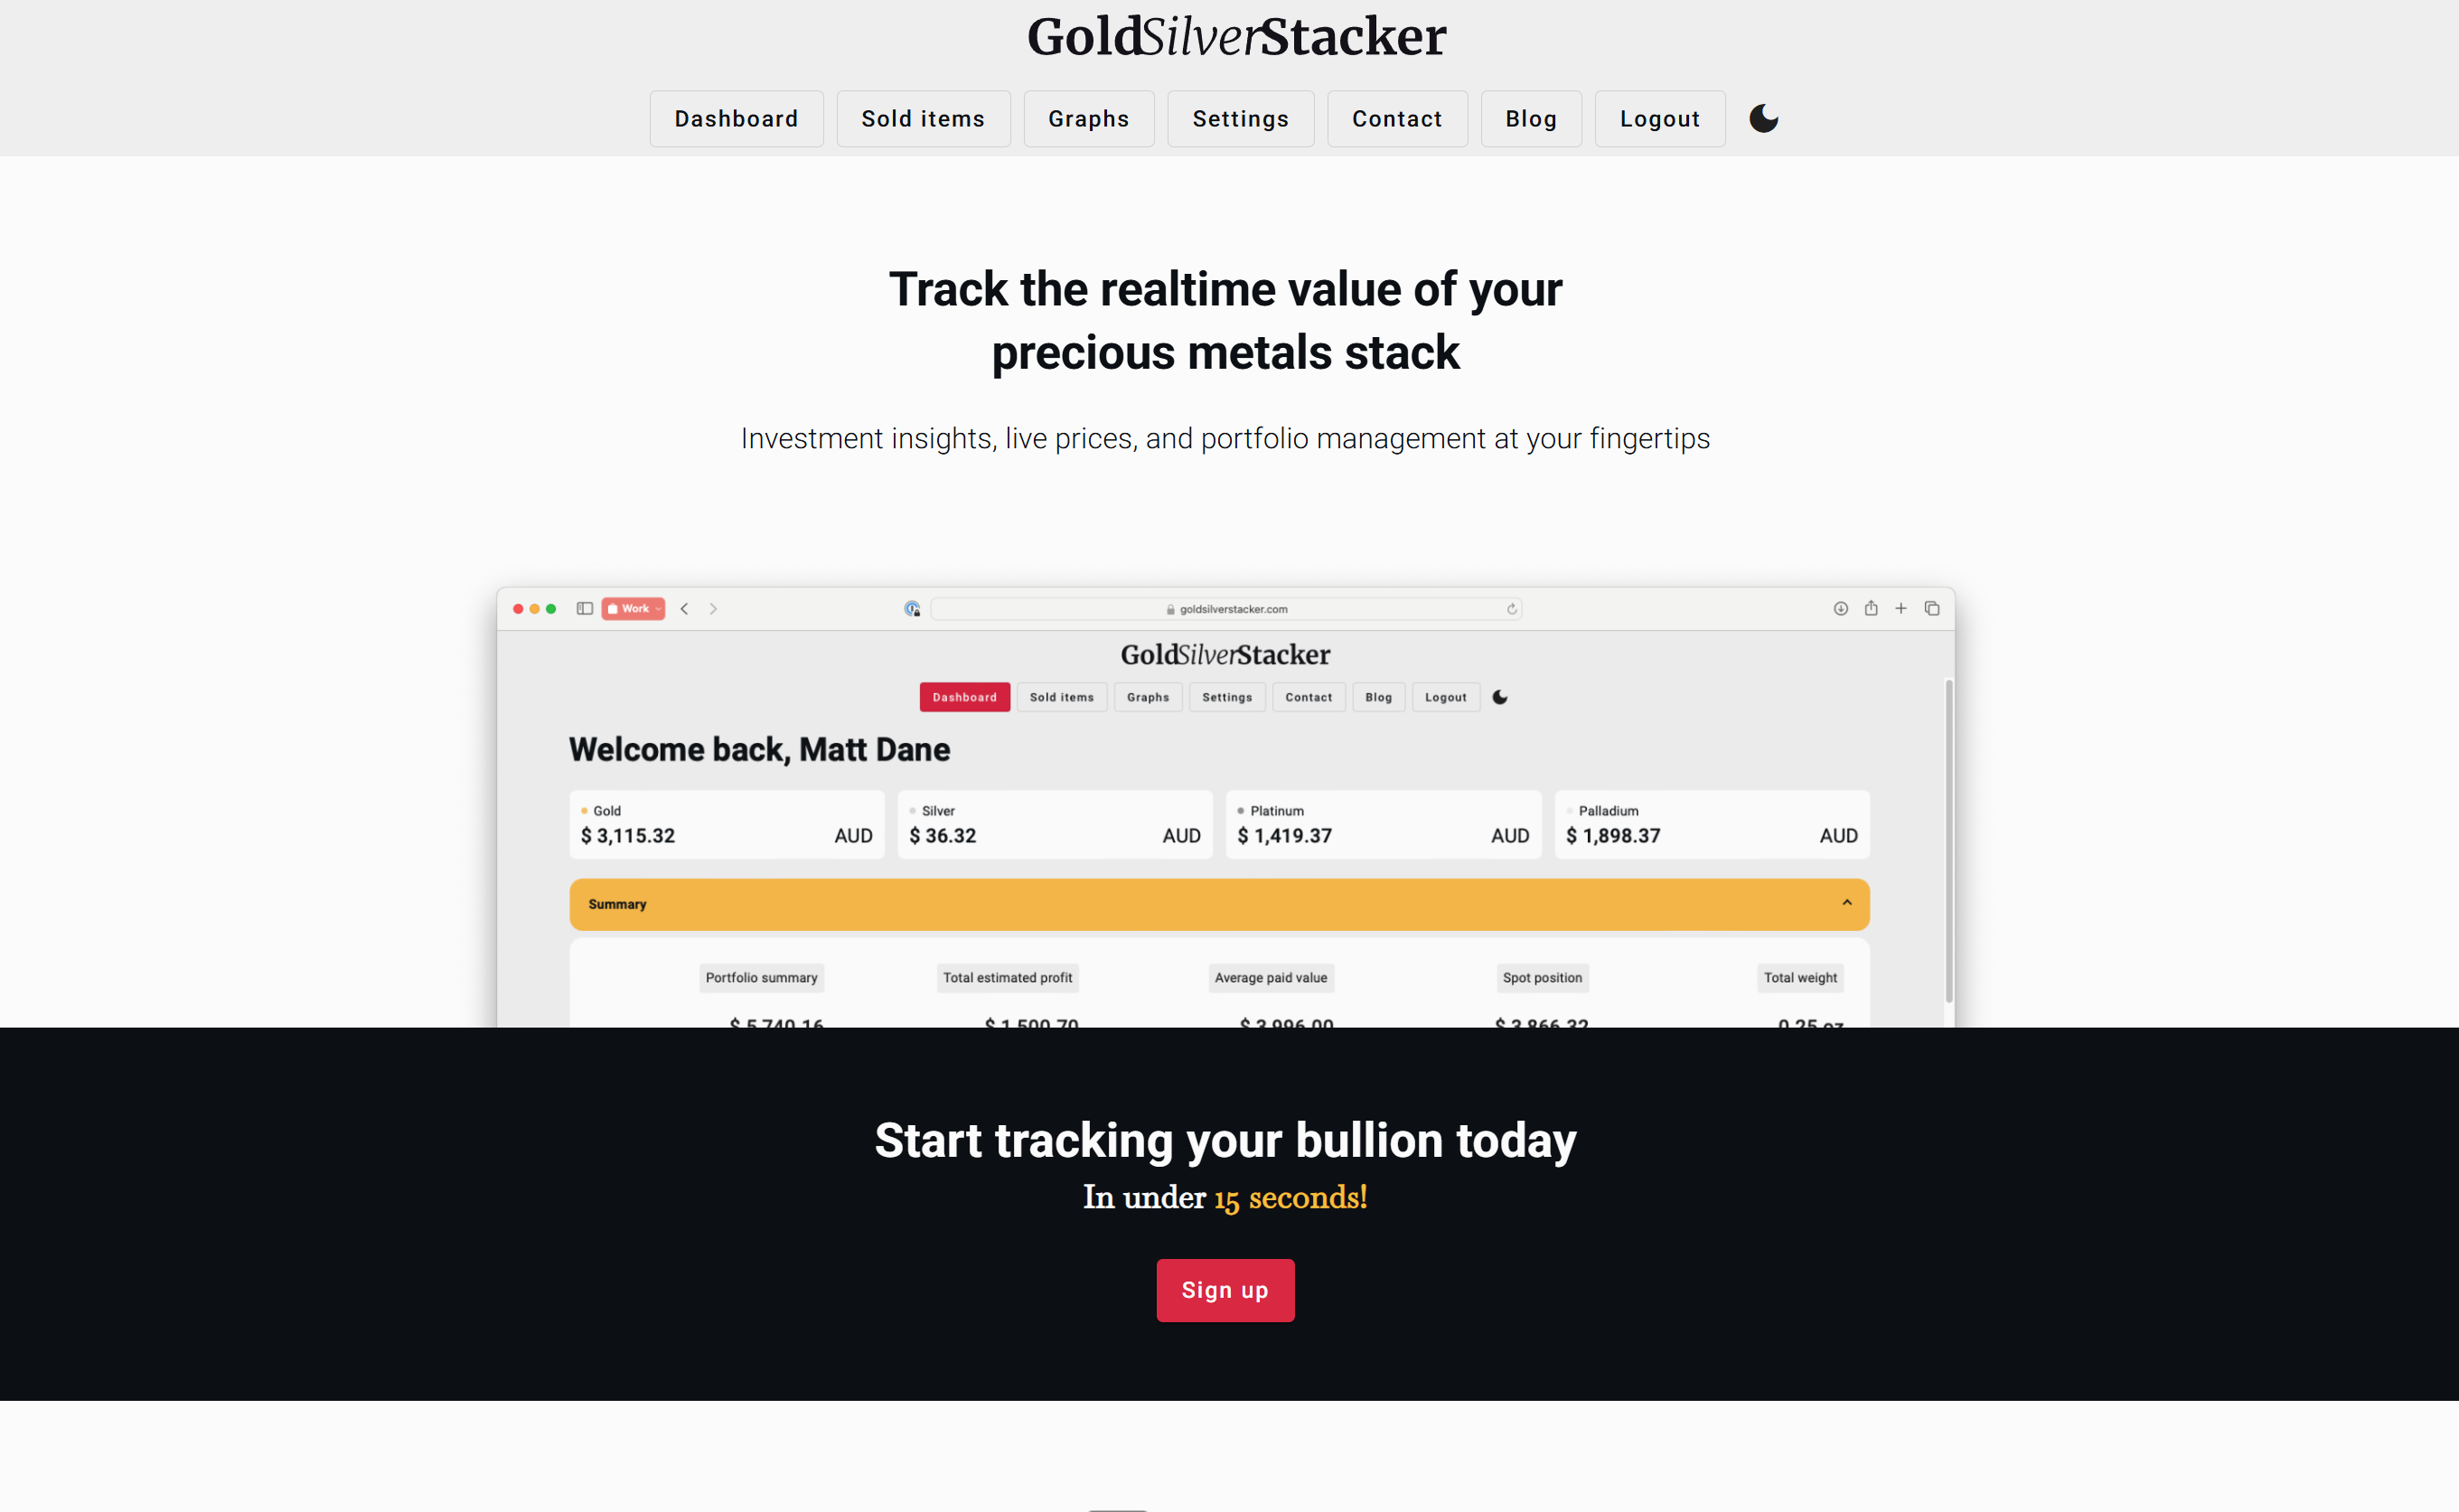
I built a real-time precious metals portfolio tracker with live AUD spot prices, profit analytics, historical value charts, and sold items management for bullion investors.
I stack silver and gold. Mostly Perth Mint coins and bars, but also some international pieces. Over the past couple of years, my stack grew to the point where I needed a proper way to track what I owned, what I paid, and what it was all worth at current spot prices.
The existing options were either basic spreadsheets (which don't update automatically) or US-focused apps that don't show AUD spot prices. I wanted something that would show me, in real time, exactly how my portfolio was performing in Australian dollars. Total paid, current market value, estimated profit, daily change. And I wanted it broken down by metal type with the ability to track individual purchases.
So I built GoldSilverStacker.
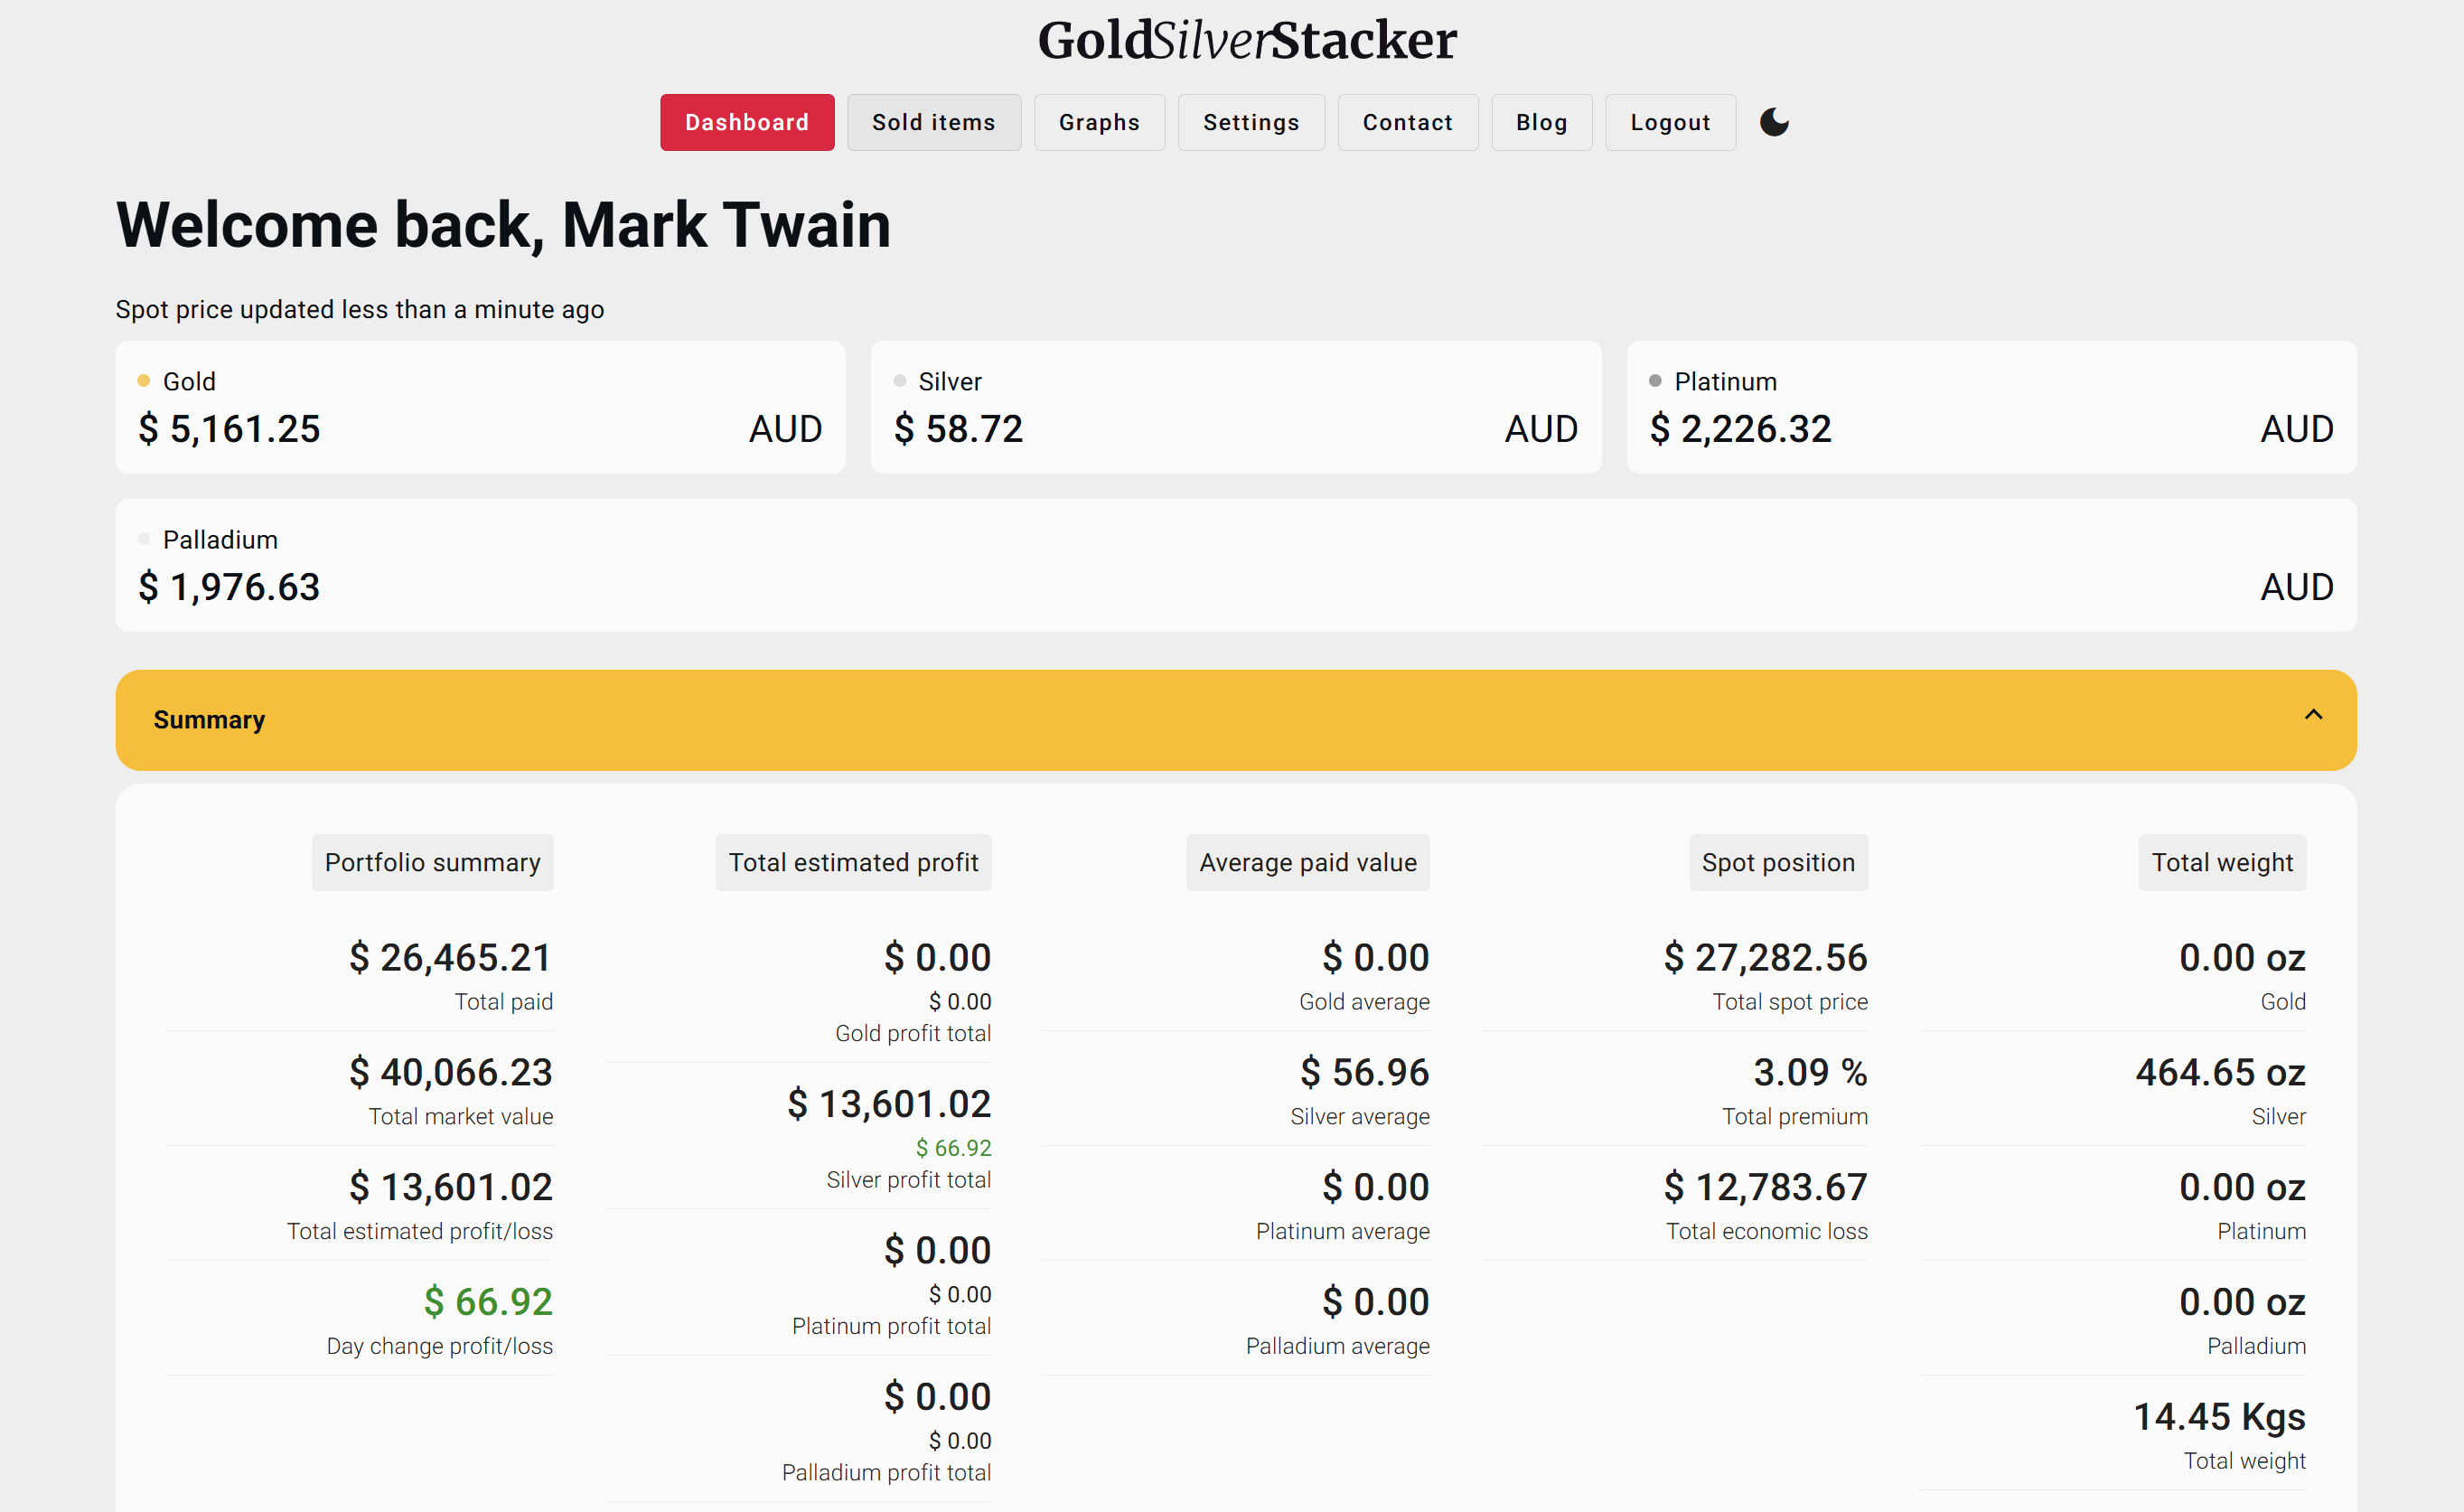
Dashboard with live AUD spot prices for gold, silver, platinum, and palladium
The Dashboard
When you log in, the first thing you see is the current spot price for gold, silver, platinum, and palladium, all in AUD. These update in real time. Below that is a full portfolio summary: total paid, total market value, estimated profit/loss, and daily change. It also shows breakdowns per metal, including average paid price, spot position, total premium paid over spot, and total weight in ounces and kilograms.
The idea is that you should be able to glance at the dashboard and immediately know how your stack is performing without doing any mental maths.
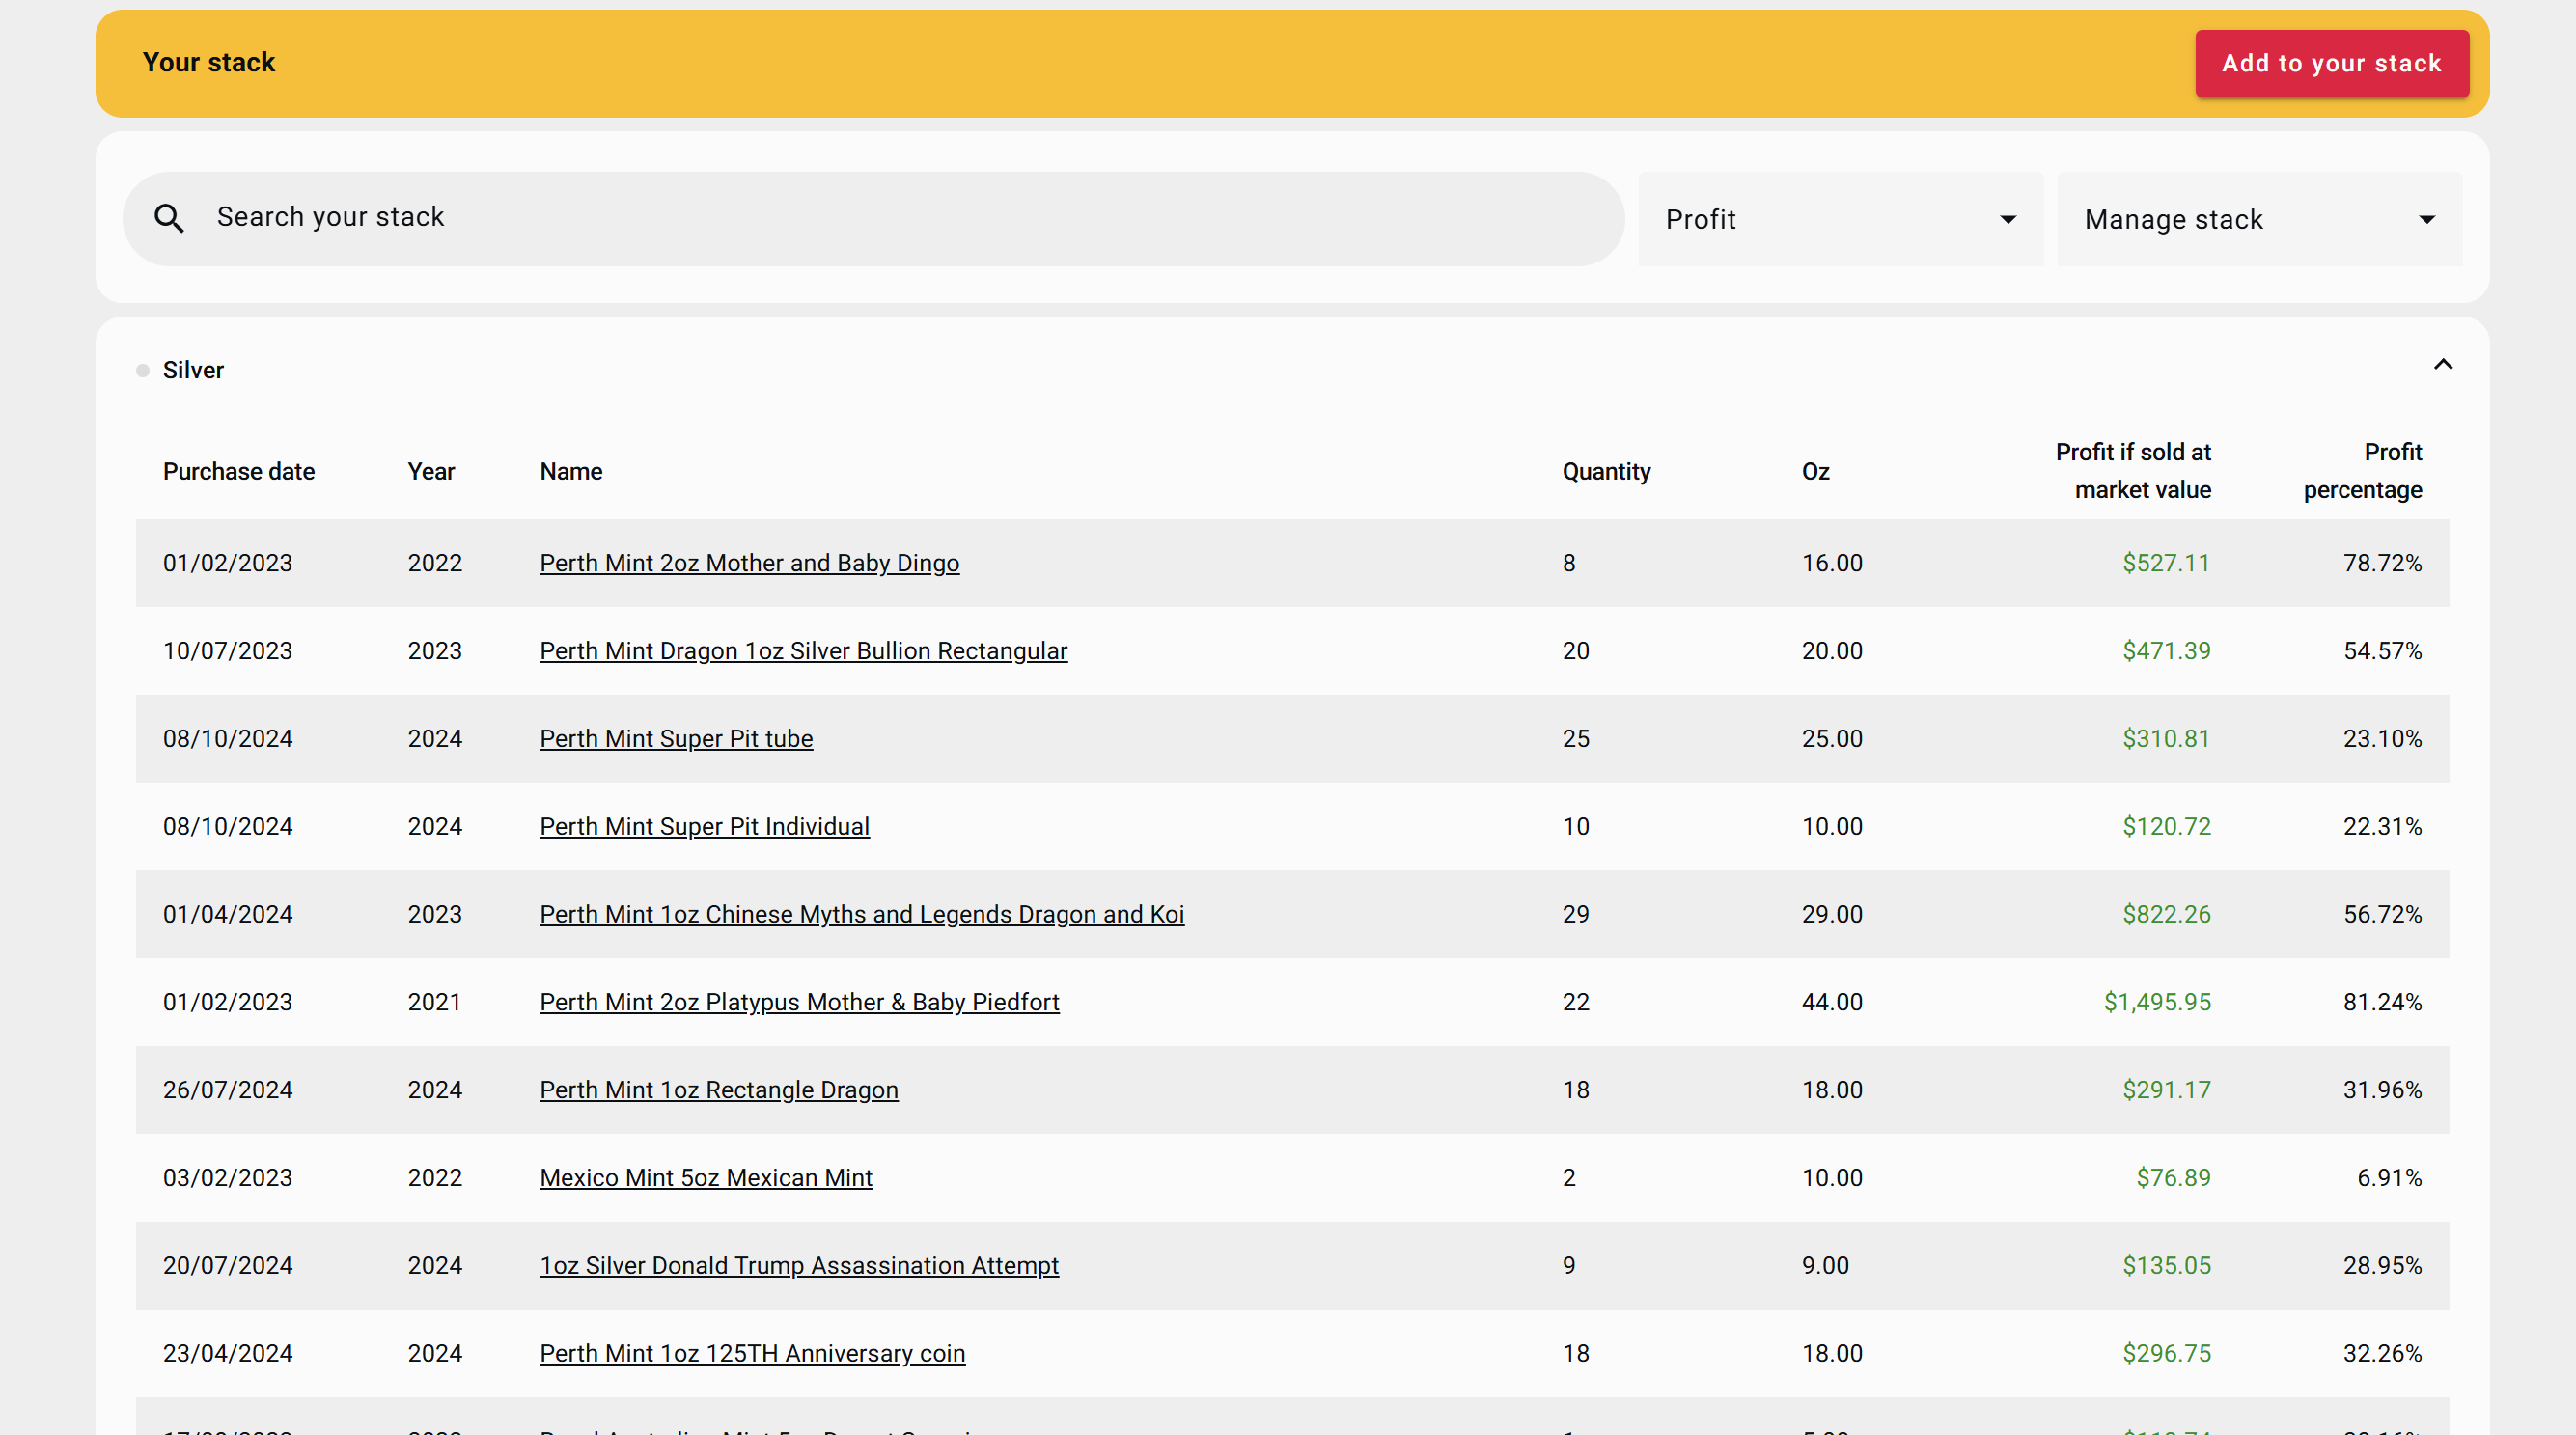
Your Stack
The main tracking view is a table of every item in your collection. Each entry includes the purchase date, year, name (e.g., "Perth Mint 2oz Mother and Baby Dingo"), quantity, total ounces, current profit if sold at market value, and profit percentage. Items are grouped by metal type, so you can see your silver stack separate from your gold.
You can search, sort by profit, and manage your stack from this view. Adding a new item is straightforward: enter the details, the purchase price, and it starts tracking against live spot immediately. The platform handles all the calculations automatically, including converting weight to ounces and tracking premiums paid over spot price at the time of purchase.
Stack view with per-item profit tracking against live spot prices
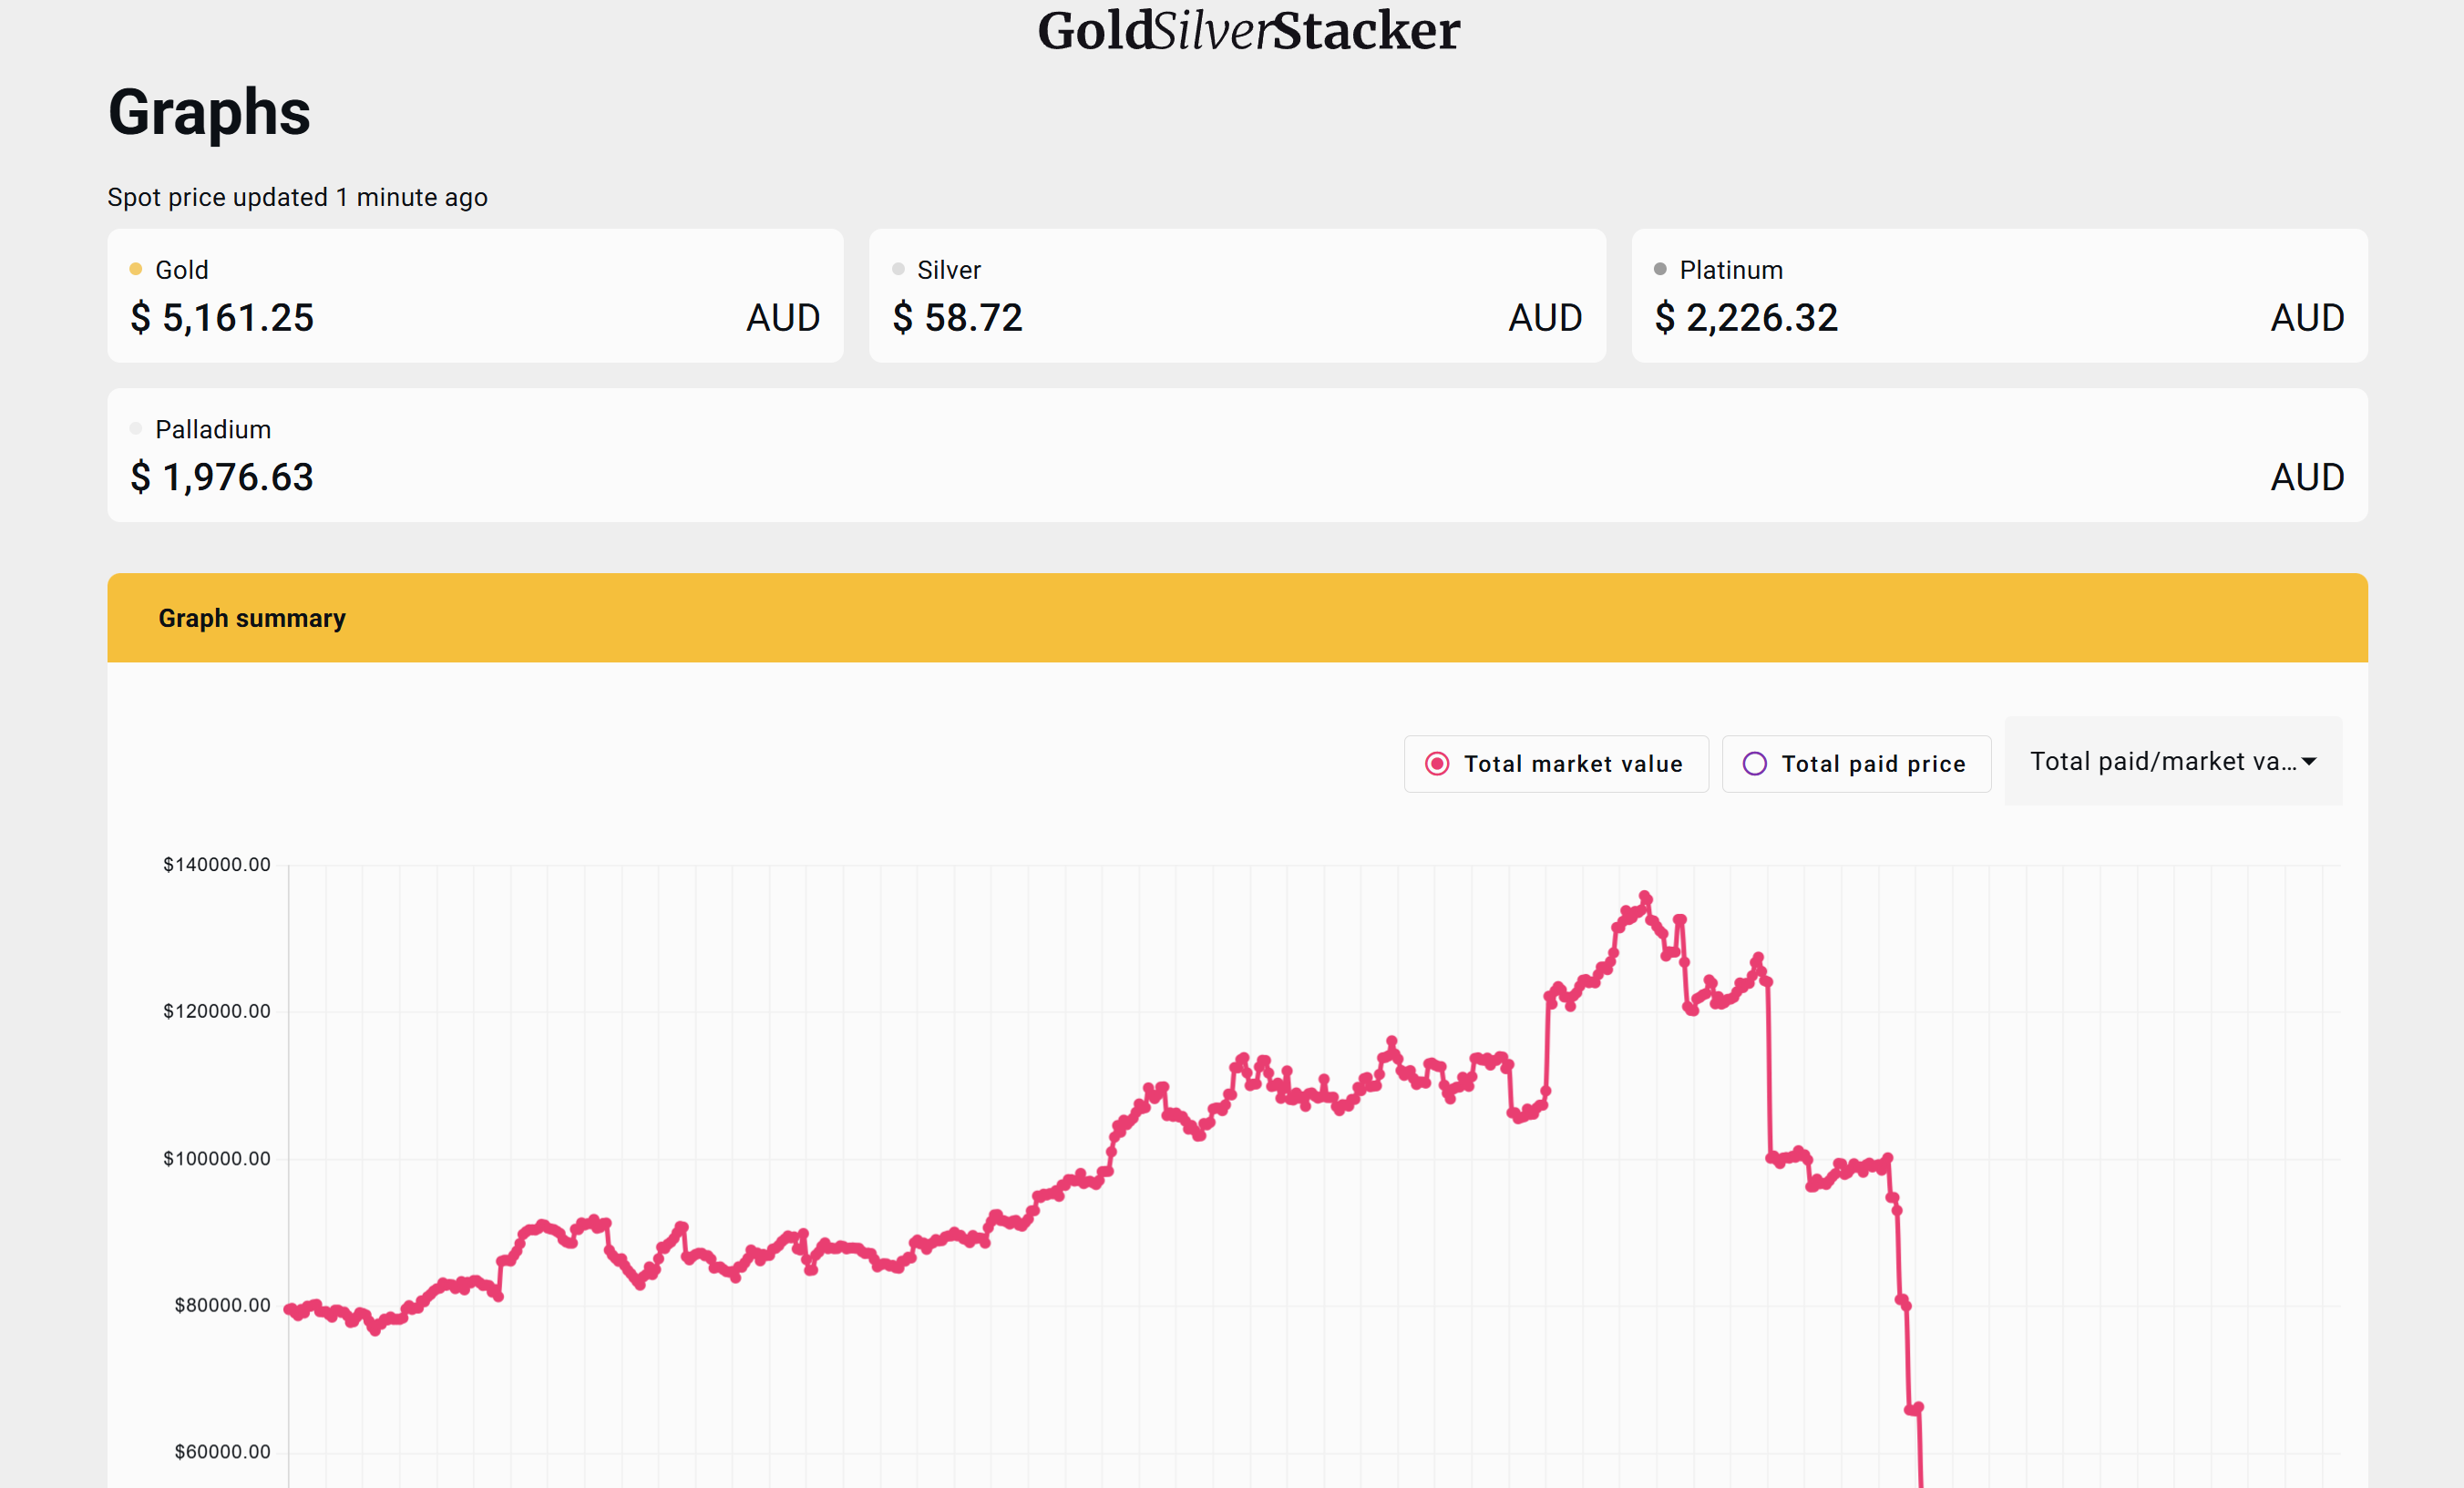
Portfolio Value Charts
The graphs page shows your total portfolio value over time, plotted against what you originally paid. This makes it easy to see how your stack's value has moved with the market. You can toggle between total market value and total paid to visualise your profit margin over any time period.
The chart also shows the live spot prices for all four metals at the top of the page, updated within the last minute. This is useful for timing purchases or just keeping an eye on where the market is sitting on any given day.
Historical portfolio value chart with live spot price indicators
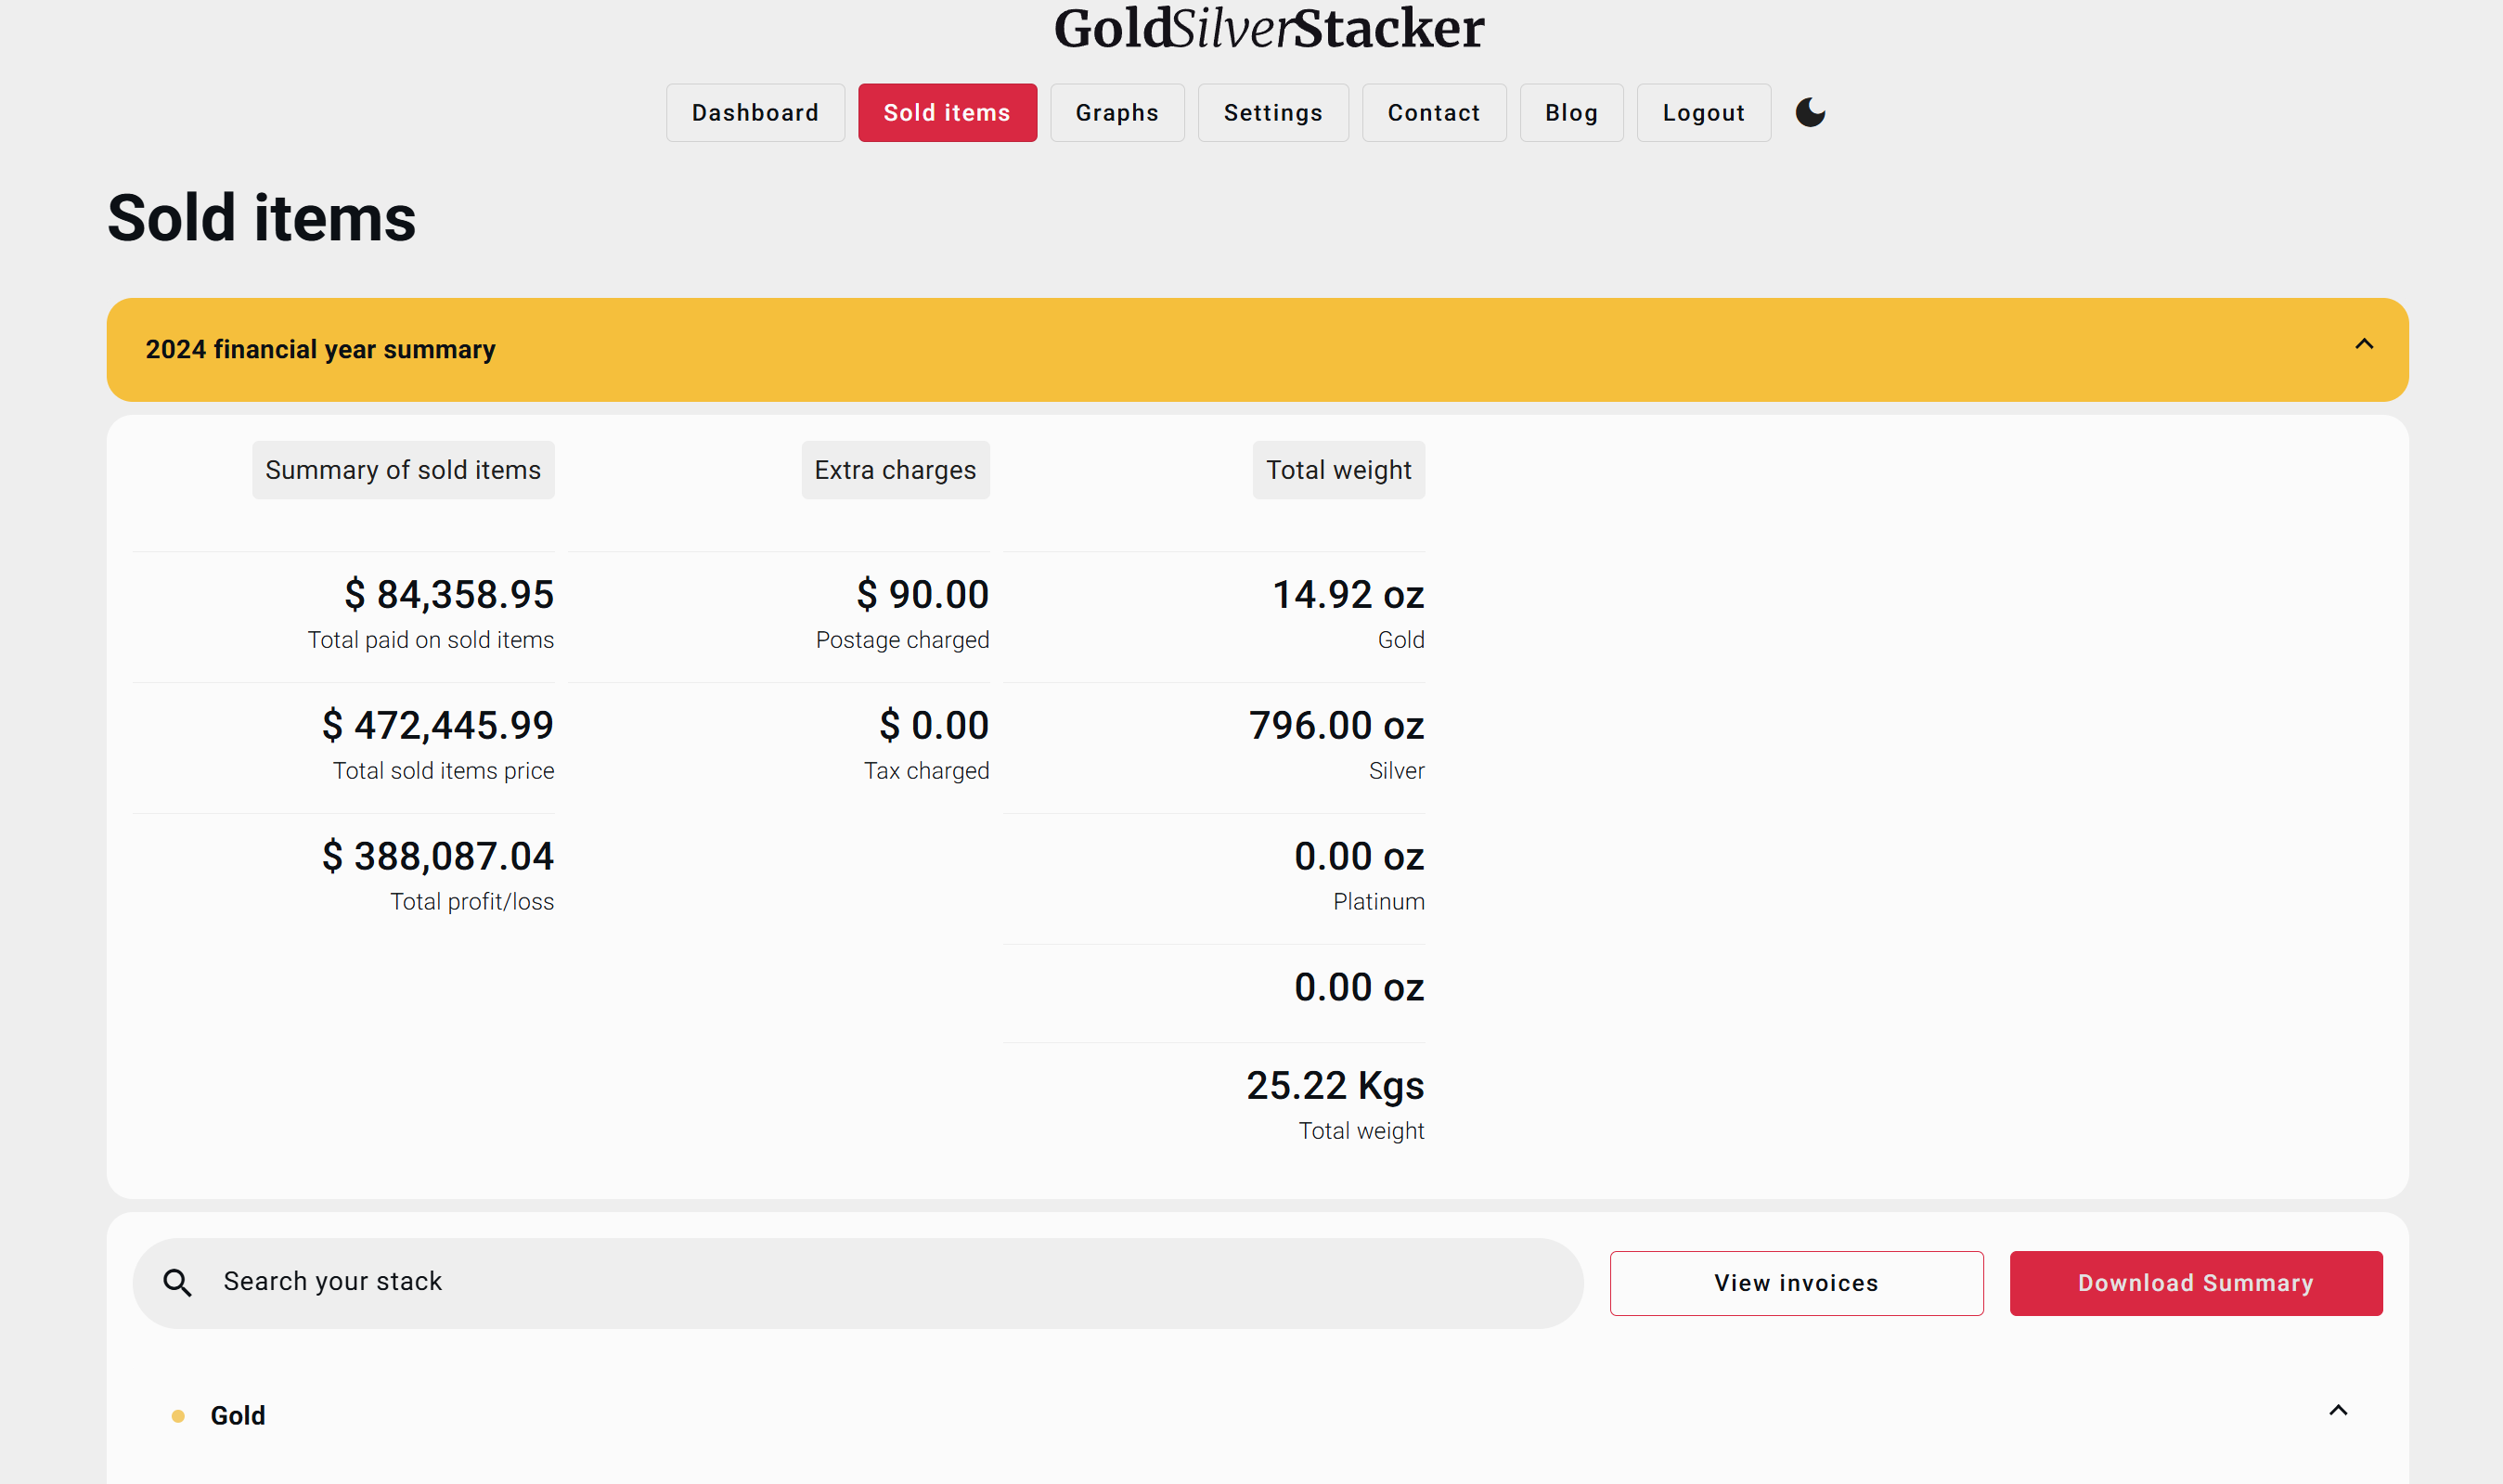
Sold Items and Tax Tracking
When you sell items from your stack, they move to the Sold Items section. This tracks everything you need for record keeping: total paid on sold items, total sold price, profit/loss, postage charged, and tax. It also breaks down the totals by metal type with weight in ounces.
You can view invoices, download a full summary, and search through your sold history. This is particularly useful come tax time, because the platform keeps a clean record of every transaction with the numbers ready to hand to your accountant.
Sold items with financial year summary, profit tracking, and downloadable reportsBuilt to Scale
GoldSilverStacker started as a tool for tracking my own bullion collection because nothing else did what I needed in AUD. It now has user authentication, a blog, settings, and the architecture to support multiple users. The platform includes dark mode, is fully responsive, and is designed to work as a SaaS product for Australian precious metals investors who want proper portfolio tracking without relying on spreadsheets.
Platform Capabilities
What the platform does
4
Metals Tracked
Gold, silver, platinum, and palladium with live AUD spot prices updated every minute
Live
Spot Prices
Real-time AUD pricing with automatic portfolio revaluation and daily P&L tracking
Per-Item
Profit Tracking
Individual item profit/loss calculated against current spot with percentage returns
Historical
Value Charts
Portfolio value over time with market value vs paid price comparison graphs
Sold Items
Management
Full sales tracking with profit, postage, tax, and downloadable financial summaries
SaaS
Ready
User authentication, settings, dark mode, and multi-user architecture for commercial launch
Technical Implementation
The technology powering the platform
React + TypeScript
Component-based frontend with type safety and modern React patterns for reliable financial data handling
Firebase
Firestore for real-time data storage, Firebase Auth for user accounts, and Firebase Hosting
Financial APIs
Live precious metals spot price feeds with AUD conversion and historical price data for charting
Portfolio Analytics
Real-time profit calculations, premium tracking, weight conversions, and financial year summaries
Need a Custom Investment Platform?
If you need a purpose-built platform for tracking investments, assets, or any kind of financial portfolio, let's talk about building something tailored to your needs.